ERCCIS manages a plethora of data that underpins our combined knowledge of the natural environment of Cornwall and Scilly. ERCCIS staff main tain and update this data, which when combined creates an essential evidence-base for a huge variety of clients and partners.
There is potential of expanding our habitat services in the future and we welcome conversations with stakeholders, organisation or researchers on how best we can provide support advice and technical skill to projects for the conservation of our environment and wildlife.
Please contact us if you have any specific questions or would like to know more.
Currently, ERCCIS can provide the following services. Please see also our products page.
Analysis and Interpretation Services
Using data contained within this evidence base or specifically gathered for the purpose ERCCIS can carry out a range data analysis and interpretation projects to your specification including;
- Species distribution and trend analysis to led into securing investment for species protection;
- Analysing geographic habitat dataset for temporal and spatial change;
- Create ecological networks or ecological opportunity maps which can focus landscape scale conservation work;
- Habitat connectivity assessment for protected species, to identify core areas, important corridors, barriers to dispersal and opportunities for improving connectivity.
All of our data analysis and interpretation projects are bespoke and tailored to your needs, if you would like to discuss your requirements or for further examples of the work we carry out, please contact wis@cornwallwildlifetrust.org.uk
Example of analysis work undertaken at ERCCIS includes;
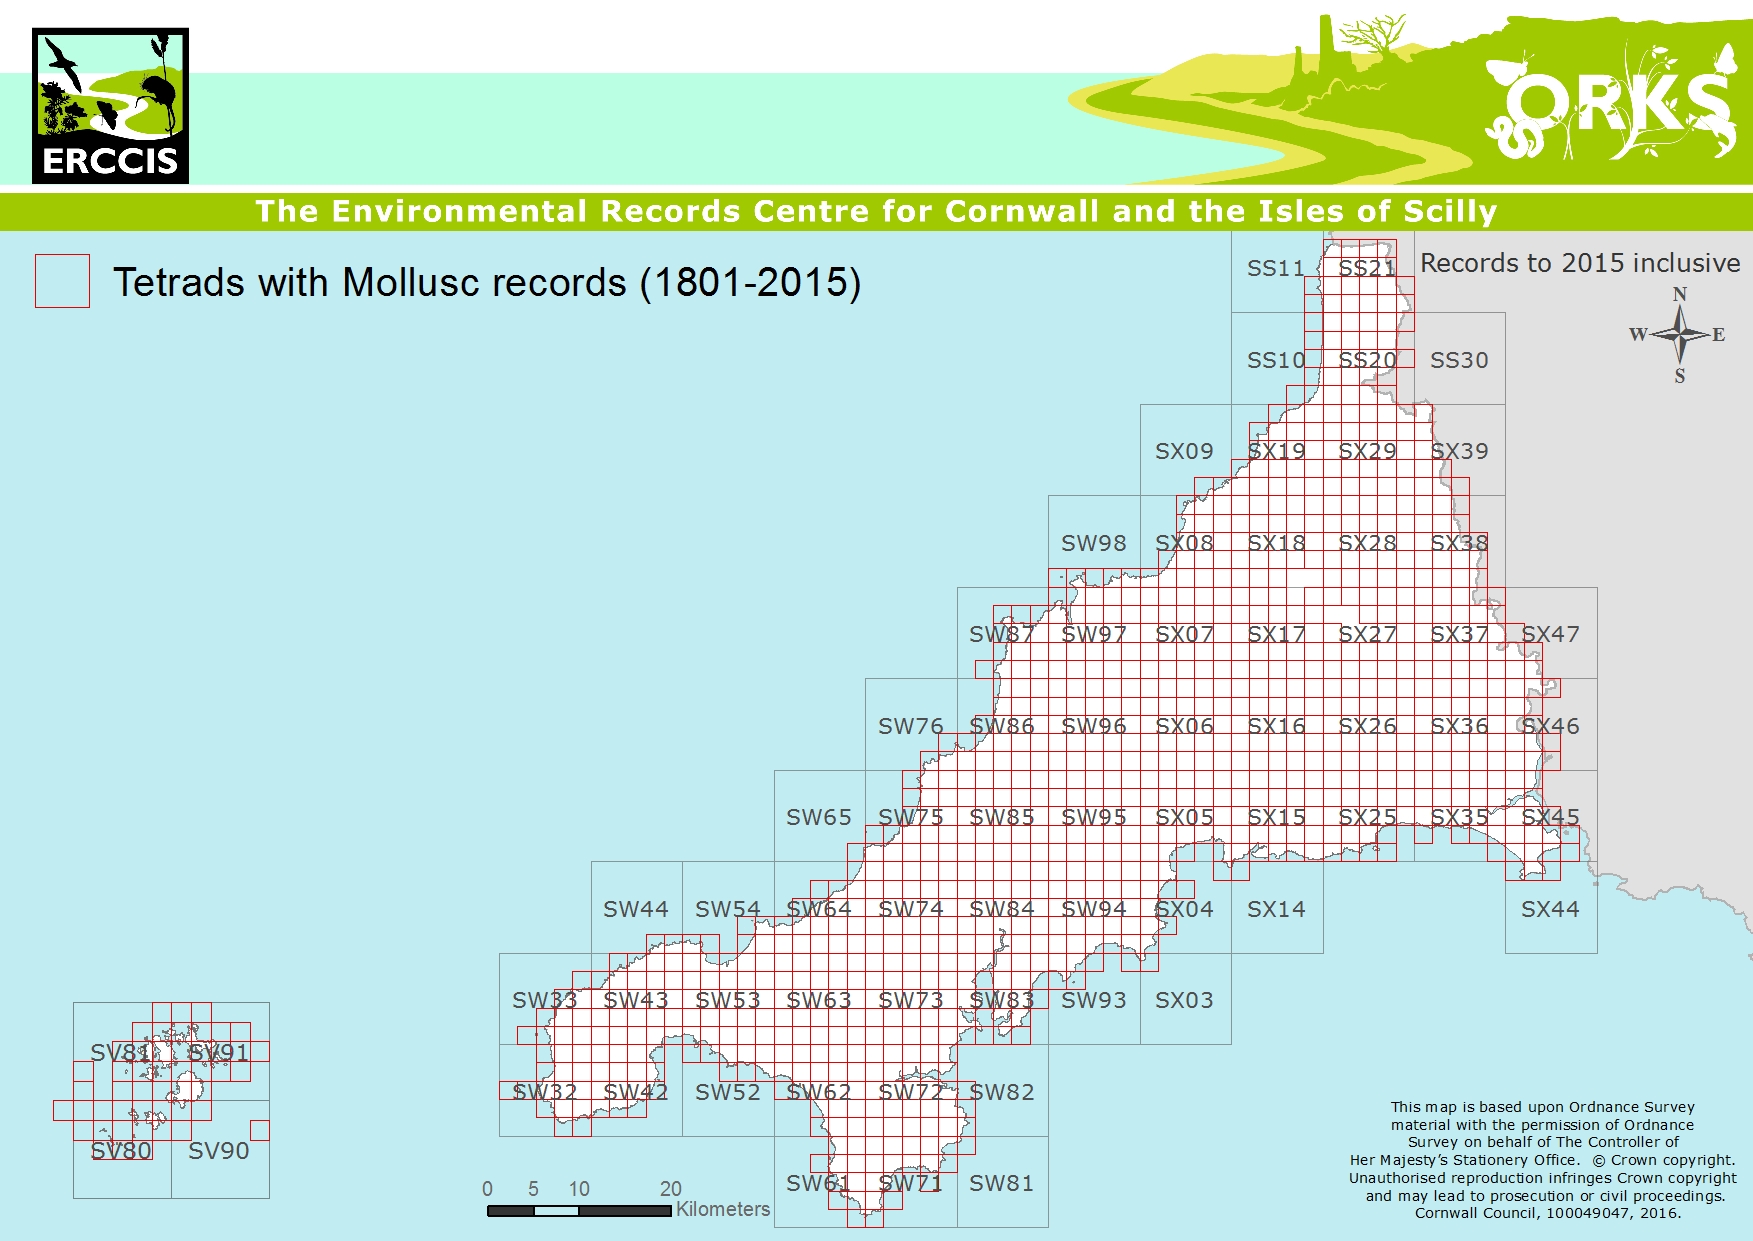
- Recording Distribution (gap analysis)
By looking at the “gaps” in records we can encourage biological records & local groups to target these known data poor location to see if particular species are truly absent from a given location or have just never been recorded in that particular location.


Visualisation Services
There are many methods of visualising data that can lead to powerful storytelling and further insights. The ability of graphs or graphics to summarise large amount of data allow you to tell the story and ERCCIS can help achieve this.
ERCCIS has many years of experience in the mapping of sites based data, biological records and model outputs. ERCCIS staff are available to create or advice on summary visualisations and infographics based on any of our hosted datasets.
Examples of ERCCIS visual services include:
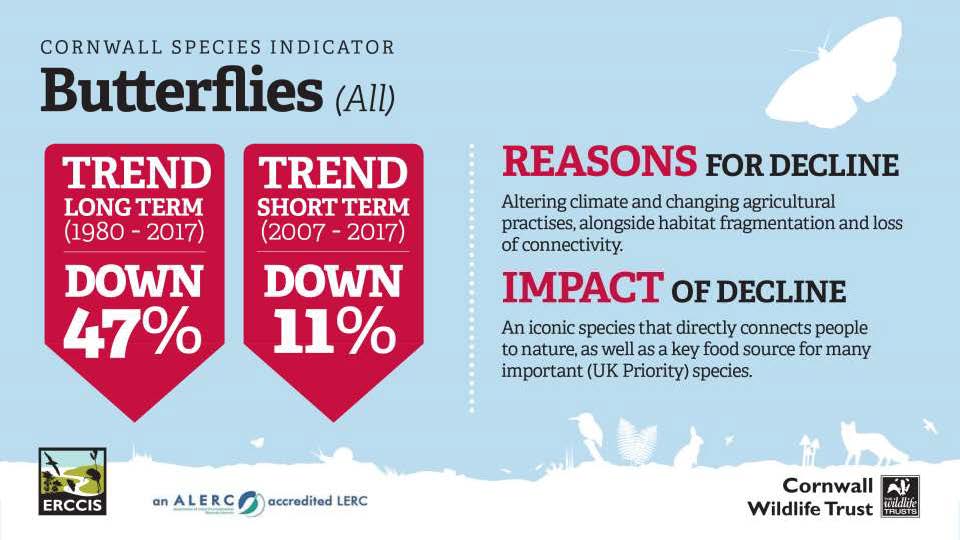
- Species Trend Analysis

ERCCIS utilised it’s biological records evidence base and complex modelling to look at the trends in species occupancy across Cornwall in the last ~40 years. While this work is currently undergoing review and remains unpublished the infographics used show the potential visual representations to convey the information.
- Visualisation of the distribution of biological recording (Visual gap analysis)

To help biological recorders get an overview of the available distribution of certain species or entire group ERCCIS often produce visualisations (most commonly maps!) of the spatial and temporal resolution of our biological data holding.
In Autumn 2019 you will be able to view every species ERCCIS host data on at 2Km resolution in the ORKS public portal. Allowing biological records to make their own gap analysis maps as needed.

